
How to Fix WordPress Posts Returning 404 Error: The Definitive Troubleshooting Guide
March 21, 2026
WordPress Security Hardening: The Complete 2025 Checklist
March 23, 2026
After more than 15 years of optimizing WordPress sites for performance, I can confidently say that Time to First Byte is one of the most misunderstood and underestimated metrics in the entire web performance ecosystem. Most WordPress developers focus heavily on front-end optimizations like lazy loading images, minifying CSS, and deferring JavaScript. While those techniques matter, they all operate downstream of a fundamental bottleneck: the server response itself. If your server takes 2 seconds to begin sending the HTML document, no amount of front-end wizardry will save the user experience. In this guide, I will walk you through exactly what TTFB is, why it disproportionately affects WordPress sites, how to measure it accurately, and 10 proven optimization strategies that I have used across hundreds of production WordPress installations to bring server response times under 200 milliseconds.
What Is TTFB and Why It Matters for WordPress
Time to First Byte, commonly abbreviated as TTFB, measures the duration between a client sending an HTTP request and receiving the first byte of the response from the server. It encompasses three distinct phases: the DNS lookup time, the TCP connection establishment (including TLS negotiation for HTTPS), and the server processing time. Of these three components, server processing time is typically the largest contributor and the one most directly under your control as a WordPress site owner. When a user types your URL and hits enter, their browser must first resolve your domain name to an IP address, then establish a connection, and finally wait while your server executes PHP code, queries the database, assembles the HTML, and begins transmitting the response. Every millisecond added to this chain directly delays the point at which the browser can begin parsing HTML, discovering subresources, and rendering content.
Google treats TTFB as a diagnostic metric within its Core Web Vitals framework. While TTFB is not itself one of the three Core Web Vitals (LCP, INP, and CLS), it has a direct causal relationship with Largest Contentful Paint. Research published by Google on web.dev demonstrates that a slow TTFB makes it nearly impossible to achieve a good LCP score because LCP cannot begin until the browser has received and parsed enough of the HTML document to discover the largest content element. In practical terms, if your TTFB is 1.5 seconds, your LCP will almost certainly exceed the 2.5-second threshold that Google considers “good.” According to data from the HTTP Archive analyzed by Google engineers, the 75th percentile TTFB across all origins on the web is approximately 1.6 seconds on mobile connections, which means the majority of websites are leaving significant performance on the table due to slow server responses.

WordPress is particularly susceptible to high TTFB because of its dynamic architecture. Unlike static site generators that serve pre-built HTML files, a default WordPress installation executes PHP on every page request. That PHP execution triggers the WordPress bootstrap process, which loads the core framework, initializes all active plugins, loads the active theme, executes the main database query to retrieve post content, runs dozens of action hooks and filters, and finally assembles the complete HTML document. On a typical WordPress site with 20 to 30 active plugins, this process can involve hundreds of database queries and significant PHP computation. I have profiled WordPress installations where the bootstrap process alone consumed 400 milliseconds before any page-specific logic even began. This architectural reality means that WordPress sites require deliberate, server-side optimization strategies to achieve competitive TTFB values.
How TTFB Works: The Request Lifecycle Explained
Understanding the full request lifecycle is essential before attempting any optimization, because you need to know precisely where time is being spent. When a visitor requests a page on your WordPress site, the following sequence occurs. First, the browser performs a DNS lookup to resolve your domain name to an IP address. This typically takes 20 to 100 milliseconds depending on whether the DNS record is cached and the performance of your DNS provider. Second, the browser establishes a TCP connection with your server, which involves a three-way handshake (SYN, SYN-ACK, ACK) that adds one round-trip time of latency. Third, if your site uses HTTPS (as it should), a TLS handshake occurs, which adds another one to two round trips depending on whether TLS 1.2 or TLS 1.3 is used. Fourth, the browser sends the HTTP request to your server. Fifth, your web server (Nginx or Apache) receives the request, determines that it requires PHP processing, and hands it off to the PHP-FPM worker pool. Sixth, the PHP worker begins executing the WordPress bootstrap sequence: loading wp-config.php, connecting to MySQL, loading the WordPress core, loading active plugins via their main files, loading the active theme’s functions.php, parsing the request URL, running the main WP_Query, executing template files, and finally calling wp_head() and wp_footer() which trigger dozens of additional hooks. Seventh, the assembled HTML response is sent back through the web server to the client.
Each of these steps contributes to the total TTFB measurement, but steps five through seven — the server-side processing — are where WordPress sites lose the most time. In my experience profiling hundreds of WordPress sites, the server processing phase accounts for 60 to 90 percent of the total TTFB. The remaining time is split between DNS resolution and connection establishment, which are addressed by different optimization strategies. A well-optimized WordPress site should complete the entire server processing phase in under 100 milliseconds for cached pages and under 300 milliseconds for uncached dynamic pages. Achieving these targets requires a multi-layered approach that addresses caching, database performance, PHP execution speed, and network latency simultaneously.
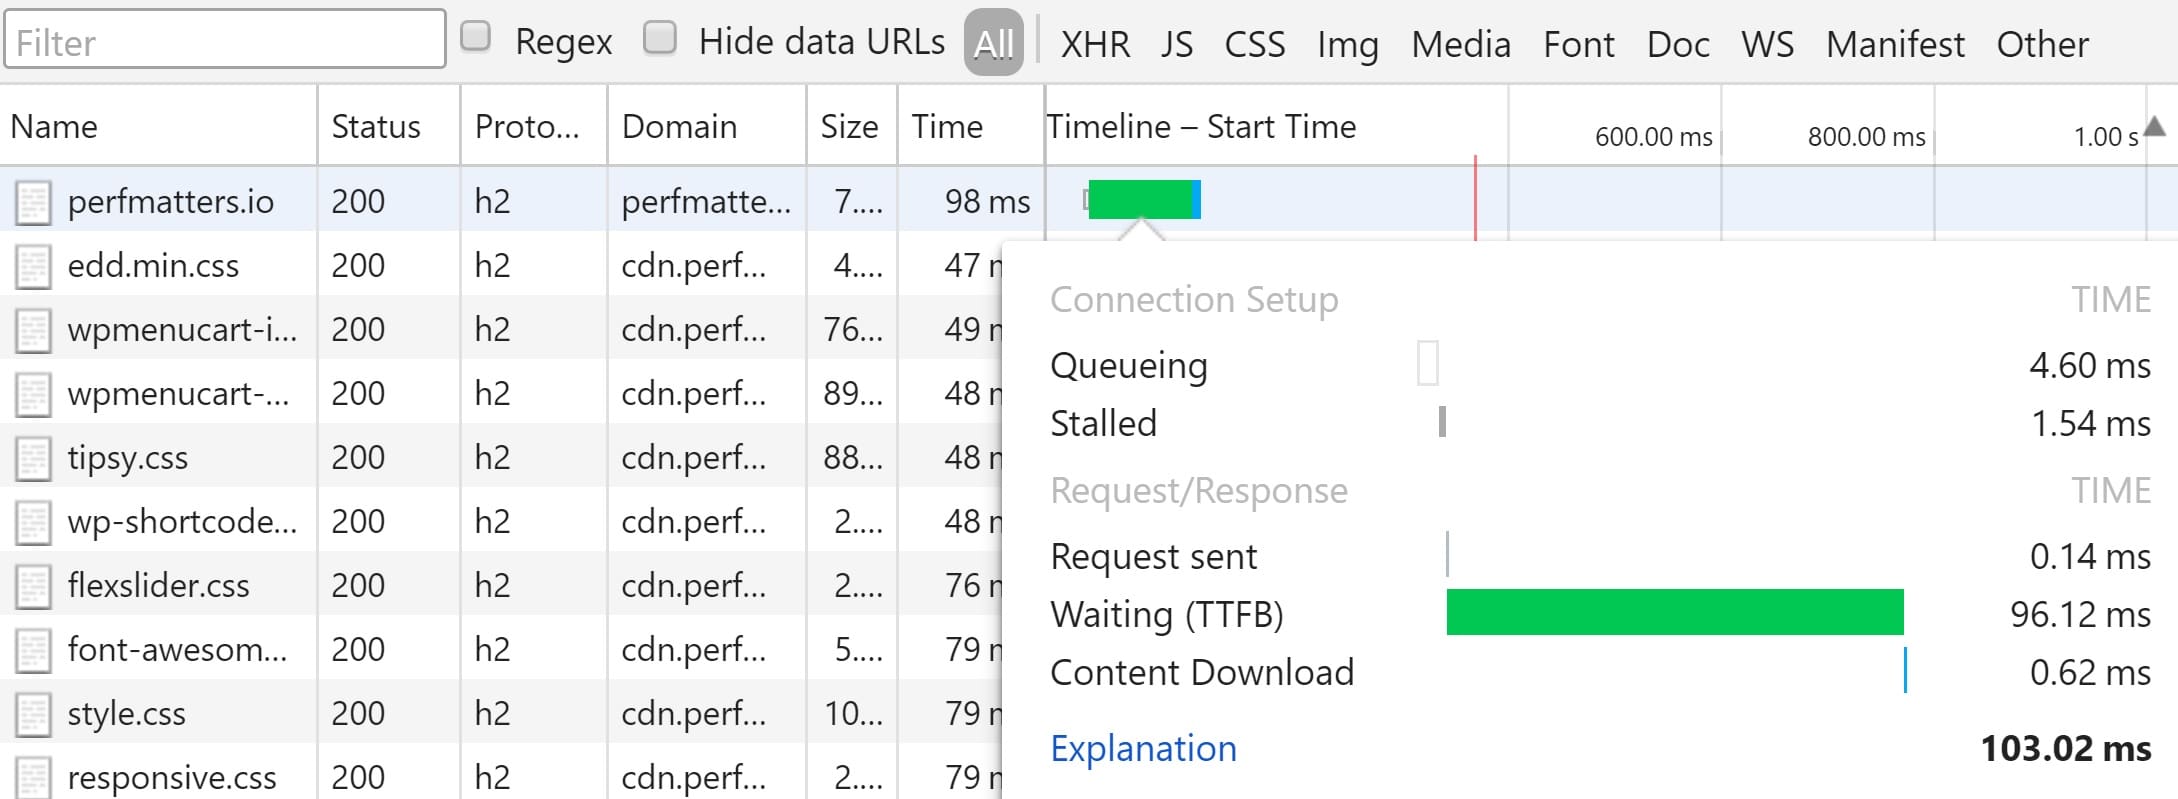
How to Measure TTFB Accurately
Before optimizing, you need a reliable baseline measurement. There are several tools and methods for measuring TTFB, and each provides slightly different information. The most accessible tool is Chrome DevTools, which is built into every Chrome and Chromium-based browser. Open DevTools with F12, navigate to the Network tab, reload the page, and click on the initial document request (the HTML file at the top of the waterfall). In the Timing tab, you will see a detailed breakdown that includes DNS Lookup, Initial Connection, SSL, and most importantly, “Waiting for server response” — this is your TTFB. Chrome DevTools is excellent for quick checks during development, but keep in mind that it measures TTFB from your current network location and is affected by your local network conditions.
For more comprehensive testing, WebPageTest (webpagetest.org) is an invaluable free tool that allows you to test from multiple geographic locations using real browsers. WebPageTest provides a detailed waterfall chart that clearly separates DNS, connect, TLS, and TTFB times. I recommend running tests from at least three different geographic regions to understand how TTFB varies for your global audience. Google PageSpeed Insights is another essential tool because it reports both lab data (from Lighthouse) and field data (from the Chrome User Experience Report). The field data is particularly valuable because it shows real TTFB values experienced by actual users over the previous 28-day collection period. Additionally, you can use the command-line tool curl with timing variables to measure TTFB programmatically. Running curl -o /dev/null -w "TTFB: %{time_starttransfer}s\n" https://yoursite.com provides a quick measurement that can be scripted for automated monitoring. For ongoing monitoring, services like Pingdom, Uptime Robot, or New Relic provide continuous TTFB tracking with alerting capabilities.
Optimization 1: Server-Level Page Caching (The Single Biggest Win)
If you implement only one optimization from this entire article, make it server-level page caching. This single change routinely reduces TTFB by 90 percent or more. The principle is straightforward: instead of executing the entire WordPress PHP stack on every request, the server stores the fully rendered HTML output and serves it directly on subsequent requests, bypassing PHP and MySQL entirely. A page that takes 800 milliseconds to generate dynamically can be served from cache in 10 to 50 milliseconds. The difference is transformative, and I have seen it turn failing Core Web Vitals scores into passing scores overnight.
There are multiple layers at which page caching can be implemented, and the closer to the web server the cache operates, the faster it performs. The fastest option is server-level caching built into your web server configuration. For Nginx, the FastCGI Cache module stores rendered pages as static files on disk and serves them without ever invoking PHP-FPM. For Apache, the mod_cache module provides similar functionality. Many managed WordPress hosts like Kinsta, WP Engine, and Cloudways implement this type of caching at the infrastructure level, which is why they typically deliver superior TTFB compared to generic shared hosting. If your host does not provide server-level caching, you can implement it via WordPress caching plugins. WP Super Cache, W3 Total Cache, WP Rocket, and LiteSpeed Cache (for LiteSpeed servers) all generate static HTML files that the web server can serve directly. The key configuration detail is ensuring that the web server is configured to check for and serve the cached file before invoking PHP.
Here is a basic Nginx FastCGI Cache configuration that I use as a starting point for most WordPress installations:
# Define cache zone in http block
fastcgi_cache_path /var/run/nginx-cache levels=1:2 keys_zone=WORDPRESS:100m inactive=60m max_size=512m;
fastcgi_cache_key "$scheme$request_method$host$request_uri";

# In server block
set $skip_cache 0;

# Don't cache POST requests
if ($request_method = POST) { set $skip_cache 1; }

# Don't cache URLs with query strings
if ($query_string != "") { set $skip_cache 1; }

# Don't cache logged-in users or recent commenters
if ($http_cookie ~* "comment_author|wordpress_[a-f0-9]+|wp-postpass|wordpress_no_cache|wordpress_logged_in") {
    set $skip_cache 1;
}

# Don't cache WooCommerce pages
if ($request_uri ~* "/cart.*|/checkout.*|/my-account.*") {
    set $skip_cache 1;
}

location ~ \.php$ {
    fastcgi_cache WORDPRESS;
    fastcgi_cache_valid 200 60m;
    fastcgi_cache_bypass $skip_cache;
    fastcgi_no_cache $skip_cache;
    add_header X-FastCGI-Cache $upstream_cache_status;

    fastcgi_pass unix:/var/run/php/php8.2-fpm.sock;
    fastcgi_index index.php;
    include fastcgi_params;
}
The impact of server-level caching on TTFB is dramatic and immediately measurable. The following comparison demonstrates the difference between an uncached and cached WordPress response on identical hardware.
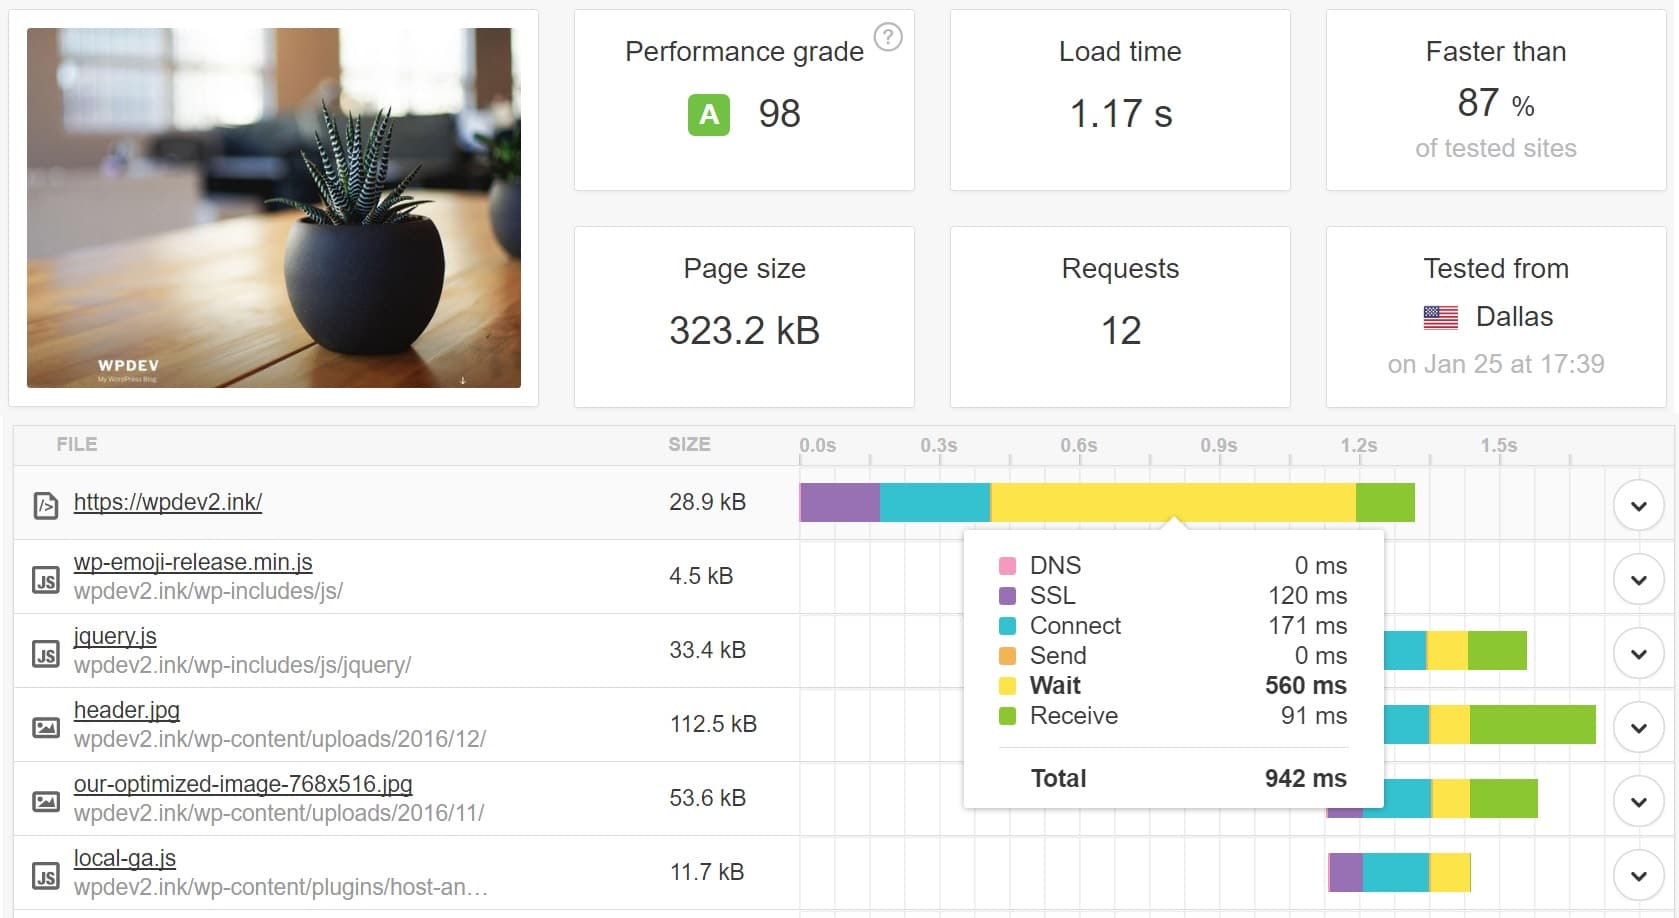
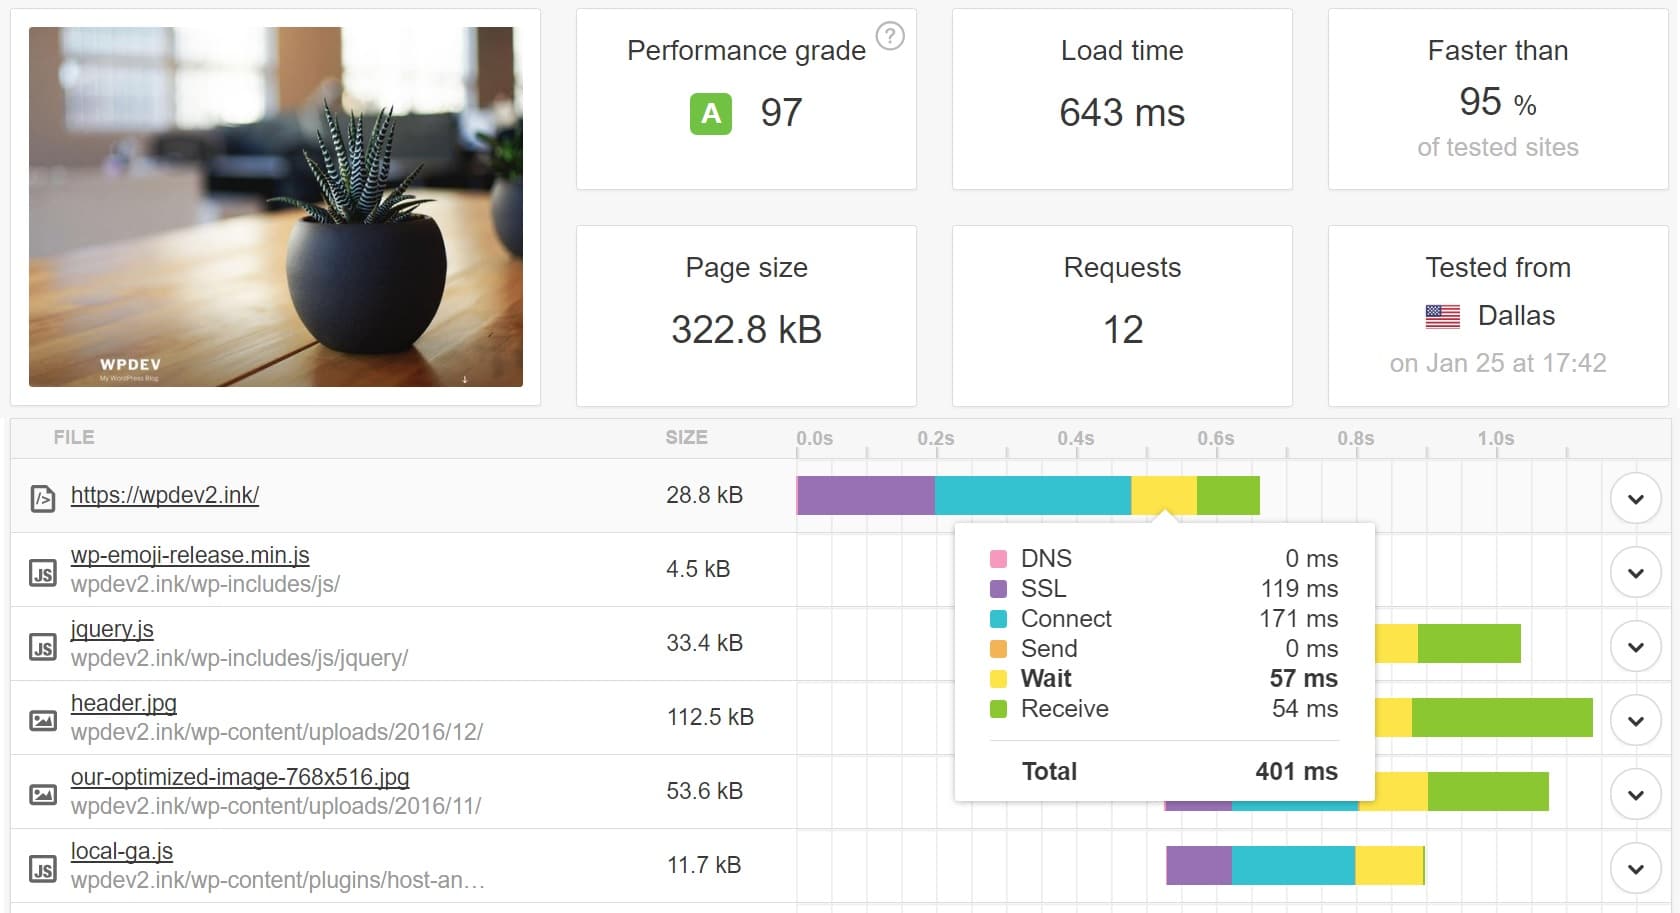
One critical aspect of page caching that many developers overlook is cache invalidation. Your caching strategy must intelligently purge cached pages when content changes. When a post is updated, only that post’s cache and any archive pages that include it should be invalidated — not the entire cache. Most WordPress caching plugins handle this automatically through hooks on post save and comment approval events. However, if you are implementing server-level caching manually, you need to build this invalidation logic yourself or use a helper plugin like Nginx Cache Controller.
Optimization 2: Use a Content Delivery Network (CDN)
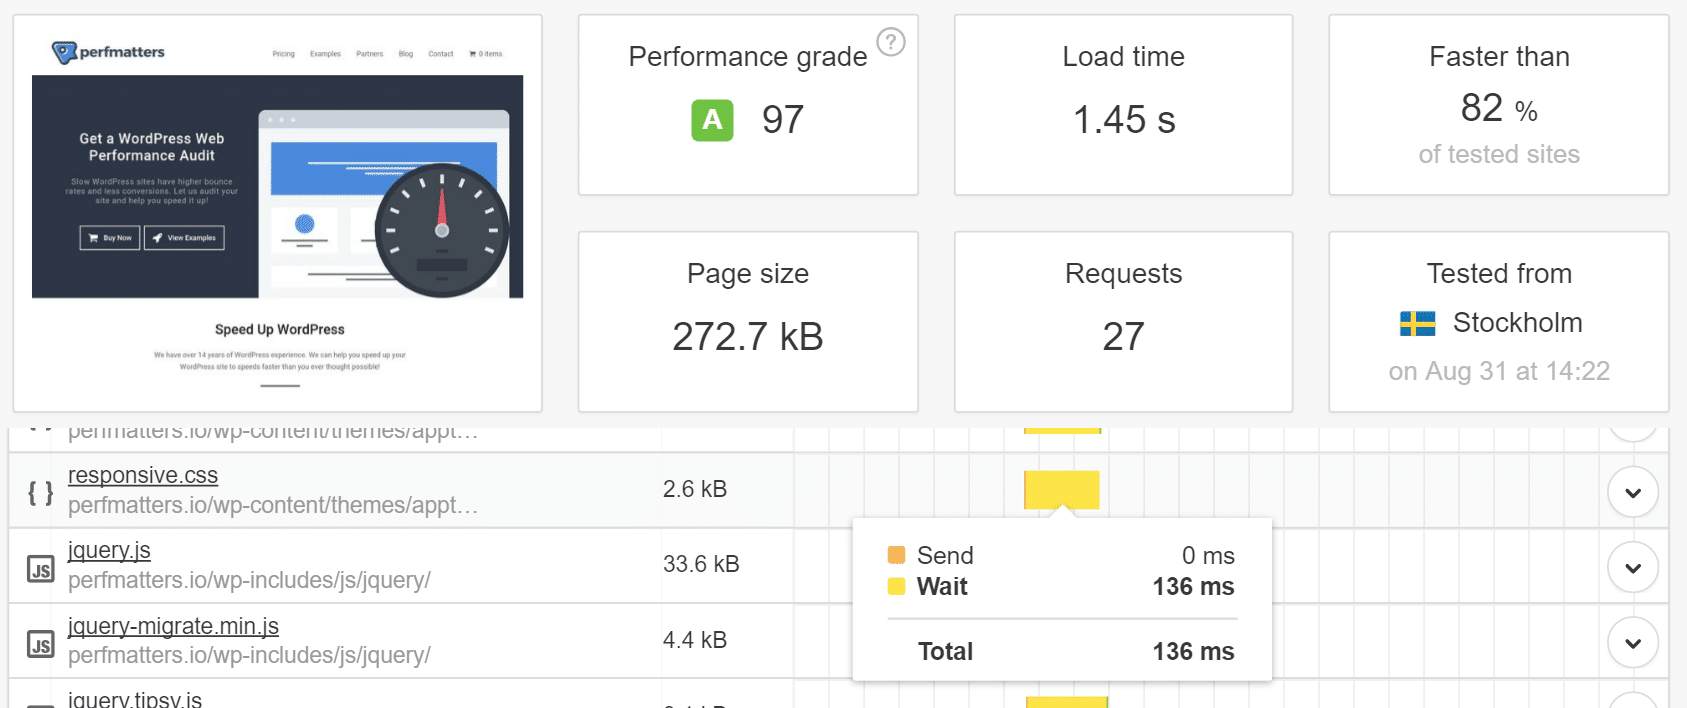
A Content Delivery Network addresses the network latency component of TTFB by distributing your content across edge servers located around the world. When a visitor from Tokyo requests a page from your server in New York, the physical distance alone introduces approximately 150 to 200 milliseconds of round-trip latency due to the speed of light through fiber optic cables. A CDN eliminates this penalty by serving the response from an edge server that is geographically close to the visitor. Modern CDNs like Cloudflare, Fastly, and Amazon CloudFront can cache not only static assets (images, CSS, JavaScript) but also full HTML pages, effectively acting as a globally distributed page cache.
For WordPress specifically, Cloudflare’s APO (Automatic Platform Optimization) deserves special mention. It was designed specifically for WordPress and caches entire HTML pages at Cloudflare’s edge, including dynamic pages that traditional CDN configurations would not cache. In testing across multiple WordPress sites, I have measured TTFB reductions of 70 to 90 percent for visitors in regions far from the origin server. Cloudflare APO costs only $5 per month for non-Cloudflare plan users and is included free with Pro and above plans, making it one of the most cost-effective TTFB optimizations available. The difference in global TTFB before and after implementing a CDN is striking.
When configuring a CDN for WordPress, pay careful attention to cache bypass rules. Pages for logged-in users, WooCommerce cart and checkout pages, and any page that sets cookies with personalized content must bypass the CDN cache to prevent one user’s personalized content from being served to another. Additionally, ensure that your CDN is configured to pass appropriate cache control headers and that cache purging is integrated with your WordPress site so that content updates are reflected quickly across all edge locations.
Optimization 3: Object Caching with Redis or Memcached
While page caching handles the majority of requests, some requests cannot be page-cached: logged-in user sessions, WooCommerce cart pages, dynamically personalized content, and admin panel pages. For these uncacheable requests, object caching becomes the critical optimization layer. WordPress has a built-in object caching API (wp_cache_set, wp_cache_get) that by default uses a non-persistent in-memory array that is discarded at the end of each request. By connecting this API to a persistent in-memory data store like Redis or Memcached, you enable database query results to be cached across requests, dramatically reducing the number of MySQL queries on every uncached page load.
Redis is my preferred choice for WordPress object caching because it supports more data structures than Memcached, offers persistence options, and includes features like key expiration and pub/sub messaging. In practice, I have seen Redis object caching reduce the number of database queries per page from 150+ down to 20 or fewer, with corresponding TTFB improvements of 30 to 50 percent on uncached pages. Here is how to set up Redis for WordPress:
# Install Redis server
sudo apt update && sudo apt install redis-server -y

# Configure Redis for WordPress (optimize memory)
sudo nano /etc/redis/redis.conf
# Set: maxmemory 256mb
# Set: maxmemory-policy allkeys-lru

# Install PHP Redis extension
sudo apt install php8.2-redis -y

# Restart services
sudo systemctl restart redis-server
sudo systemctl restart php8.2-fpm

# Verify Redis is running
redis-cli ping
# Should return: PONG
After installing Redis, add the following to your wp-config.php to connect WordPress to your Redis instance:
// Redis Object Cache configuration in wp-config.php
define('WP_REDIS_HOST', '127.0.0.1');
define('WP_REDIS_PORT', 6379);
define('WP_REDIS_DATABASE', 0);
define('WP_REDIS_TIMEOUT', 1);
define('WP_REDIS_READ_TIMEOUT', 1);

// Optional: Redis key prefix to avoid collisions in multi-site
define('WP_REDIS_PREFIX', 'wp_mysite_');

// Optional: Disable Redis for specific cache groups
define('WP_REDIS_IGNORED_GROUPS', ['counts', 'plugins', 'themes']);
Then install and activate the Redis Object Cache plugin by Till Kruess, and enable it from the WordPress admin panel under Settings > Redis. The plugin will create the object-cache.php drop-in file in your wp-content directory. You can verify it is working by checking the Redis monitoring command redis-cli monitor while loading pages — you should see GET and SET operations for WordPress cache keys. For WooCommerce sites, object caching is especially impactful because WooCommerce sessions, cart data, and product queries heavily use the WordPress object cache API.
Optimization 4: Optimize PHP Version and OPcache
PHP version has a direct and measurable impact on WordPress TTFB. Each major PHP release brings significant performance improvements through internal engine optimizations. PHP 8.2 and 8.3 execute WordPress code approximately 2 to 3 times faster than PHP 7.0, according to benchmarks published by Kinsta and Starter Publishing. The JIT (Just-In-Time) compiler introduced in PHP 8.0 provides additional performance gains for CPU-intensive operations, although its impact on typical WordPress workloads is more modest than the general engine improvements. If your hosting provider allows PHP version selection, upgrading to the latest stable PHP version is one of the simplest TTFB optimizations you can make.
Equally important is properly configuring OPcache, PHP’s built-in bytecode cache. Without OPcache, PHP must parse and compile every .php file into opcodes on every request. With OPcache enabled and properly configured, compiled bytecodes are stored in shared memory and reused across requests, eliminating the compilation overhead entirely. A typical WordPress installation with plugins loads 200 to 500 PHP files per request, so the compilation savings are substantial. Here is my recommended OPcache configuration for WordPress production servers:
; OPcache configuration for WordPress (php.ini or opcache.ini)
opcache.enable=1
opcache.memory_consumption=256
opcache.interned_strings_buffer=16
opcache.max_accelerated_files=10000
opcache.revalidate_freq=60
opcache.validate_timestamps=1
opcache.save_comments=1
opcache.enable_file_override=1

; JIT settings for PHP 8.0+ (optional, moderate benefit for WordPress)
opcache.jit=1255
opcache.jit_buffer_size=128M

; Preloading for PHP 7.4+ (advanced — requires custom preload script)
; opcache.preload=/path/to/preload.php
; opcache.preload_user=www-data
The max_accelerated_files setting should be at least as large as the total number of PHP files in your WordPress installation. You can count your PHP files with find /path/to/wordpress -name "*.php" | wc -l. Setting this value too low means some files will not be cached and will still require compilation. The revalidate_freq setting controls how often OPcache checks if files have changed on disk — in production, setting this to 60 seconds or higher reduces filesystem stat calls. On staging or development environments, you may want to set validate_timestamps=1 with a lower revalidate_freq so changes are picked up quickly.
Optimization 5: Database Optimization
The WordPress database is often the hidden culprit behind high TTFB, particularly on sites that have been running for years without maintenance. Three specific database issues cause the most TTFB degradation: excessive autoloaded options, orphaned transients, and unoptimized table structures. The wp_options table is queried on every single page load to retrieve all rows where the autoload column is set to “yes.” On a clean WordPress installation, autoloaded data totals about 500KB. On a typical production site with numerous plugins, I routinely find 2 to 10 MB of autoloaded data, which must be loaded into memory and deserialized on every request. This single query can add 50 to 200 milliseconds to your TTFB.
You can identify the current size and top contributors to autoloaded data with these SQL queries and WP-CLI commands:
-- Check total autoloaded data size
SELECT SUM(LENGTH(option_value)) AS autoload_size
FROM wp_options WHERE autoload = 'yes';

-- Find largest autoloaded options
SELECT option_name, LENGTH(option_value) AS size
FROM wp_options WHERE autoload = 'yes'
ORDER BY size DESC LIMIT 20;

-- Count expired transients
SELECT COUNT(*) FROM wp_options
WHERE option_name LIKE '%_transient_timeout_%'
AND option_value < UNIX_TIMESTAMP();
# WP-CLI commands for database optimization
# Delete expired transients
wp transient delete --expired
# Delete all transients (they will regenerate)
wp transient delete --all
# Optimize database tables
wp db optimize
# Clean post revisions (keep last 5)
wp post delete $(wp post list --post_type='revision' --format=ids) --force
# Set revision limit in wp-config.php
# define('WP_POST_REVISIONS', 5);
# Check autoloaded options size
wp db query "SELECT SUM(LENGTH(option_value)) as size FROM wp_options WHERE autoload='yes';"
# Identify plugins storing large autoloaded data
wp db query "SELECT option_name, LENGTH(option_value) as size FROM wp_options WHERE autoload='yes' ORDER BY size DESC LIMIT 20;"Beyond WordPress-specific optimizations, tuning your MySQL or MariaDB server configuration can yield significant TTFB improvements. The most impactful settings are the InnoDB buffer pool size (which should be set to 70 to 80 percent of available RAM on a dedicated database server), the query cache (deprecated in MySQL 8.0 but still relevant for MariaDB), and the max connections setting. Here is a baseline MySQL tuning configuration for a WordPress server with 4GB of RAM:
# MySQL/MariaDB optimization for WordPress (/etc/mysql/conf.d/wordpress.cnf)
[mysqld]
# InnoDB Settings
innodb_buffer_pool_size = 2G
innodb_log_file_size = 256M
innodb_flush_log_at_trx_commit = 2
innodb_flush_method = O_DIRECT
innodb_buffer_pool_instances = 4

# Connection Settings
max_connections = 150
wait_timeout = 300
interactive_timeout = 300

# Temporary Tables
tmp_table_size = 64M
max_heap_table_size = 64M

# Query Optimization
join_buffer_size = 4M
sort_buffer_size = 4M
read_buffer_size = 2M

# Table Cache
table_open_cache = 4000
table_definition_cache = 2000

# Slow Query Log (enable for debugging)
slow_query_log = 1
slow_query_log_file = /var/log/mysql/slow.log
long_query_time = 0.5
Additionally, add the following constants to your wp-config.php file to reduce database overhead:
// Database optimization constants for wp-config.php

// Limit post revisions to reduce wp_posts table bloat
define('WP_POST_REVISIONS', 5);

// Empty trash after 7 days instead of 30
define('EMPTY_TRASH_DAYS', 7);

// Disable WordPress cron and use system cron instead
define('DISABLE_WP_CRON', true);
// Add to system crontab: */5 * * * * curl -s https://yoursite.com/wp-cron.php > /dev/null 2>&1

// Increase memory limits for complex queries
define('WP_MEMORY_LIMIT', '256M');
define('WP_MAX_MEMORY_LIMIT', '512M');
Optimization 6: DNS Optimization
DNS resolution is the first step in the TTFB chain, and a slow DNS provider can add 50 to 150 milliseconds to every initial page load. Many domain registrars include basic DNS hosting that uses a small number of nameservers with limited geographic distribution. Switching to a premium DNS provider can reduce DNS lookup times from 100+ milliseconds to under 10 milliseconds. Cloudflare DNS, Amazon Route 53, Google Cloud DNS, and DNSimple are all excellent choices with globally distributed anycast networks that ensure fast resolution regardless of the visitor’s location.
You can measure your current DNS resolution time using the dig command: dig yoursite.com | grep "Query time". If your query time consistently exceeds 50 milliseconds from various locations, switching DNS providers will provide a measurable TTFB improvement. Beyond the provider choice, ensure that your DNS records have appropriate TTL (Time to Live) values. A TTL of 3600 seconds (1 hour) is reasonable for most sites, as it balances caching efficiency with the ability to make changes when needed. Very low TTLs (60 to 300 seconds) are useful during migrations but should be increased afterward to reduce DNS lookup frequency for returning visitors.
Optimization 7: Reduce Plugin Overhead
Every active WordPress plugin adds to the server processing time by loading its PHP files, registering hooks, and potentially executing database queries on every page load. While individual plugins may add only 5 to 20 milliseconds each, a site with 30 to 50 plugins can accumulate 200 to 500 milliseconds of plugin overhead alone. The solution is not necessarily to eliminate plugins, but to audit them strategically. Install the Query Monitor plugin, which provides a detailed breakdown of PHP execution time, database queries, and hooks fired by each plugin on every page. Use this data to identify the most expensive plugins and evaluate whether they can be replaced with lighter alternatives, deactivated on pages where they are not needed, or optimized through configuration changes.
Some common plugin categories that disproportionately impact TTFB include page builders (which load their entire rendering framework on every request), social sharing plugins (which make external API calls), statistics and analytics plugins (which log every page view to the database), and broken or abandoned plugins with inefficient database queries. In my optimization work, I have frequently found that removing or replacing a single poorly coded plugin reduced TTFB by 100 to 300 milliseconds. The WP-CLI profiling commands can also help identify slow plugins: wp profile hook --all shows the execution time of each hook, revealing which plugins consume the most processing time. Additionally, consider using conditional plugin loading techniques — plugins like Plugin Organizer or Perfmatters allow you to disable specific plugins on specific pages, preventing unnecessary code execution.
Optimization 8: Choose the Right Hosting
Your hosting infrastructure sets the ceiling for how low your TTFB can go, and no amount of software optimization can overcome fundamentally slow hardware. Shared hosting environments, where dozens or hundreds of sites share a single server’s CPU, RAM, and I/O bandwidth, typically produce TTFB values of 500 to 2000 milliseconds because your PHP processes must compete for limited resources. Managed WordPress hosts like Kinsta (Google Cloud Platform), WP Engine, Closte (Google Cloud), and Cloudways (DigitalOcean, Vultr, or AWS) provide isolated container environments with dedicated resources, server-level caching, and optimized server stacks that routinely achieve TTFB under 200 milliseconds.
When evaluating hosting for TTFB, the most important factors are: CPU generation and allocation (modern AMD EPYC and Intel Xeon Scalable processors significantly outperform older generations), storage type (NVMe SSDs are 5 to 10 times faster than SATA SSDs for random I/O operations that characterize database workloads), RAM allocation (sufficient RAM prevents swapping and enables larger database buffer pools), server location (choose a data center close to your primary audience), and server stack (Nginx with PHP-FPM outperforms Apache with mod_php for WordPress workloads). The price difference between shared hosting at $5 per month and quality managed hosting at $30 to $50 per month is trivial compared to the TTFB and reliability improvements. For any site where performance matters — business sites, e-commerce stores, content sites with advertising revenue — managed WordPress hosting is the minimum acceptable infrastructure investment.
Optimization 9: HTTP/2, HTTP/3, and 103 Early Hints
While HTTP/2 and HTTP/3 are primarily associated with improved asset loading through multiplexing and header compression, they also contribute to TTFB reduction through connection-level optimizations. HTTP/2’s header compression using HPACK reduces the overhead of each request and response. HTTP/3, which runs on QUIC instead of TCP, eliminates the TCP handshake entirely by combining the connection establishment and TLS handshake into a single round trip (0-RTT for returning connections), which can reduce TTFB by 100 to 200 milliseconds for returning visitors, particularly on high-latency mobile connections.
The 103 Early Hints status code, supported by Cloudflare and some modern web servers, is a particularly interesting mechanism for perceived TTFB improvement. When a server receives a request, it can immediately send a 103 response containing Link headers that tell the browser to begin preconnecting to or preloading critical resources before the final 200 response is ready. This allows the browser to begin fetching CSS, fonts, and other critical assets during what would otherwise be idle “waiting” time. Cloudflare has implemented 103 Early Hints as a one-click feature, and WordPress sites behind Cloudflare can benefit from it without any code changes. In testing, 103 Early Hints have improved LCP by 100 to 500 milliseconds even without changing the actual TTFB, because the browser can parallelize more work during the server processing phase.
Optimization 10: Server-Timing Header for TTFB Debugging
The Server-Timing HTTP header is an underutilized but extraordinarily valuable tool for diagnosing exactly where your TTFB is being spent. This header allows the server to communicate timing metrics back to the browser, which displays them in DevTools alongside the standard timing breakdown. By adding Server-Timing headers that measure individual components of your WordPress processing pipeline, you can pinpoint exactly which phase is causing slowness — whether it is database queries, PHP execution, object cache misses, or external API calls.
Here is a practical implementation that you can add to your WordPress theme’s functions.php or a custom plugin:
// Server-Timing header implementation for WordPress TTFB debugging
// Add to functions.php or a custom mu-plugin

add_action('send_headers', function() {
    global $timestart;

    $metrics = [];

    // Total WordPress processing time
    $total = microtime(true) - $timestart;
    $metrics[] = sprintf('wp-total;dur=%.1f;desc="WP Total"', $total * 1000);

    // Database query metrics
    global $wpdb;
    if (defined('SAVEQUERIES') && SAVEQUERIES && !empty($wpdb->queries)) {
        $db_time = array_sum(array_column($wpdb->queries, 1));
        $metrics[] = sprintf('db;dur=%.1f;desc="DB Queries (%d)"', $db_time * 1000, count($wpdb->queries));
    }

    // Object cache hit rate
    if (function_exists('wp_cache_get_stats')) {
        $stats = wp_cache_get_stats();
        if (isset($stats['hits']) && isset($stats['misses'])) {
            $hit_rate = $stats['hits'] / max(1, $stats['hits'] + $stats['misses']) * 100;
            $metrics[] = sprintf('cache-hitrate;dur=%.0f;desc="Cache Hit Rate %%"', $hit_rate);
        }
    }

    if (!empty($metrics)) {
        header('Server-Timing: ' . implode(', ', $metrics));
    }
});

// Enable SAVEQUERIES for debugging (disable in production for performance)
// define('SAVEQUERIES', true); // Add to wp-config.php
With this implementation in place, you can open Chrome DevTools, navigate to the Network tab, click on the document request, and see your custom Server-Timing metrics displayed alongside the standard timing data. This turns TTFB from an opaque number into a fully transparent breakdown, making it immediately obvious whether you need to optimize database queries, improve cache hit rates, or address PHP execution time. I recommend deploying this on staging environments and enabling it temporarily in production when investigating TTFB issues, then disabling the SAVEQUERIES constant once you have gathered the data you need.
Prevention and Ongoing Monitoring
Reducing TTFB is not a one-time task — it requires ongoing monitoring and maintenance to prevent regression. Establish a monitoring system that tracks TTFB over time and alerts you when it exceeds acceptable thresholds. Services like Uptime Robot (free tier available), Pingdom, and New Relic provide continuous synthetic monitoring from multiple global locations. Set your alert threshold at 500 milliseconds for cached pages and 1000 milliseconds for uncached pages. Additionally, monitor real user TTFB through the Chrome User Experience Report data available in Google Search Console and PageSpeed Insights.
Implement a monthly maintenance routine that includes: clearing expired transients, optimizing database tables, reviewing autoloaded options size, verifying cache hit rates (both page cache and object cache), checking PHP error logs for warnings that could indicate inefficient code execution, and auditing newly installed plugins for performance impact. Use the Query Monitor plugin during audits to catch any new performance regressions introduced by theme or plugin updates. For high-traffic WordPress sites, consider implementing a staging environment where you test all updates and changes with TTFB measurement before deploying to production. This prevents the common scenario where a plugin update introduces a slow database query or external API call that degrades TTFB for all visitors.
Finally, establish a performance budget that includes a TTFB target. I recommend targeting under 200 milliseconds for cached pages and under 500 milliseconds for uncached dynamic pages. Document your optimization configurations, caching rules, and database maintenance procedures so that they are preserved through server migrations and team changes. Performance optimization is a practice, not a project, and the sites that maintain excellent TTFB over time are those with systematic monitoring and maintenance processes in place.
Conclusion
Time to First Byte is the foundation upon which all other web performance metrics are built. For WordPress sites, achieving a fast TTFB requires addressing the platform’s inherent dynamic processing overhead through a layered optimization strategy. Start with server-level page caching — it delivers the single largest TTFB improvement and benefits every visitor. Add a CDN to eliminate geographic latency for your global audience. Implement Redis object caching to accelerate uncacheable pages. Upgrade to the latest PHP version with properly configured OPcache. Clean up and tune your database. Switch to a premium DNS provider. Audit your plugins for performance impact. Choose hosting infrastructure that provides adequate CPU, memory, and I/O resources. Enable HTTP/3 and 103 Early Hints for connection-level improvements. And deploy Server-Timing headers to maintain visibility into your server processing pipeline.
In my experience working with hundreds of WordPress sites, implementing these 10 strategies consistently brings TTFB from the 1000 to 3000 millisecond range down to under 200 milliseconds for cached pages and under 500 milliseconds for uncached pages. The impact on user experience is immediate and measurable — pages feel instant, bounce rates decrease, and Core Web Vitals scores improve. More importantly, a fast TTFB creates the performance headroom that allows front-end optimizations to achieve their full potential. There is no single magic bullet, but by methodically addressing each layer of the TTFB stack, you can achieve server response times that compete with static sites while retaining the full power and flexibility of WordPress.